Washington Migration History 1850-2018
 Other state maps: California, Florida, Illinois, Texas, New York, Alabama, Arizona, Colorado, Utah, Virginia, Washington, all other states
by James Gregory
Washington remains today a state where most residents came from somewhere else, either another state or another country. Occupied by the United States in the 1840s, it's population grew slowly until statehood in 1889, then surged after the discovery of gold in Alaska and the Yukon in 1896. In the 20th century, wars brought rapid population growth as military bases, shipyards, and aircraft manufacturing transformed the economy of Puget Sound. The population passed 2 million in the 1940s, 3 million in the 1960s, and 4 million by 1980. Growth slowed a bit during that decade but since 1990 the population grows by about 100,000 each year, 1 million each decade, reaching 7.4 million in 2017.
In the 19th and early 20th centuries, whites from the upper Midwest, many of German and Scandinavian background, were the most likely newcomers. The population remained 98 percent white until World War II with small numbers of Japanese, Chinese, and Filipinos joining surviving Native nations in the other 2 percent. African Americans began to come west in substantial numbers after 1940, many from Louisiana and Texas.
Since the 1980s migration flows have accelerated and changed. California has been the leading contributor, followed by Oregon, and Mexico. Still 78 percent white, the state has attracted a diverse population of newcomers from Latin America and Asia, notably China, the Philippines, India, Vietnam, and Korea. East Africans have also been part of the recent migration sequence, especially for Seattle/King County (see county tab below). In the most recent census, migrants from Ethiopia, Somalia, Kenya, Eritrea, and other African nations comprised more than one-third of the county's Black population.
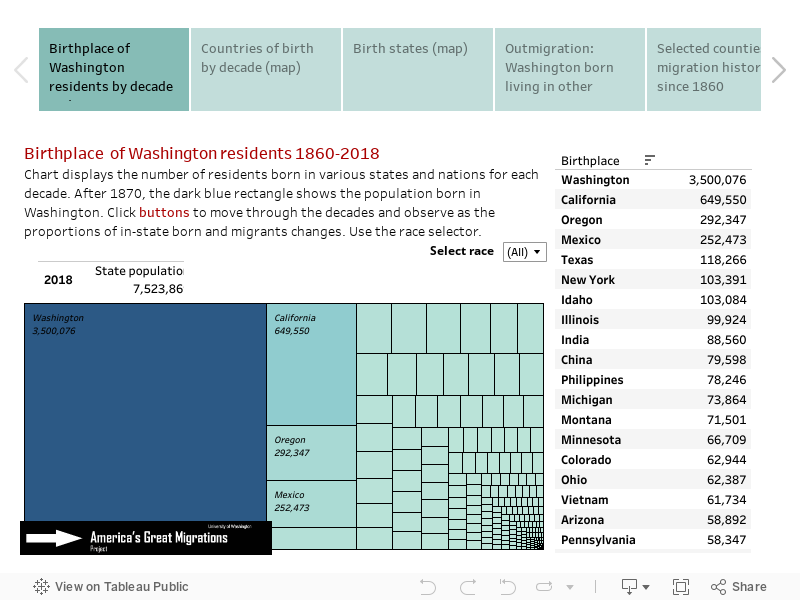
Notice in the visualization below that the dark blue rectangle representing population born in state remains much smaller than the out-of-state born throughout the 150 year period. This visualization tool is hosted by Tableau Public and may take a few seconds to respond. If slow, refresh the page. Click here for other state migration histories
Move between four visualizations with tabs below
Note on data issues: Birth state information is missing for about 5% of US-born persons in 1970 and about 2% in 1960. These birthplaces are labeled "United States, ns" in the charts. Birthplaces were not recorded for enslaved persons in the 1850 and 1860 censuses, so it is not until 1870 that reliable data on African Americans became available. Native Americans were not routinely included in decennial censuses until 1900.
Source: U.S. Census data from the Minnesota Population Center's IPUMS USA: Steven Ruggles, Katie Genadek, Ronald Goeken, Josiah Grover, and Matthew Sobek. Integrated Public Use Microdata Series: Version 6.0 [Machine-readable database]. Minneapolis: University of Minnesota, 2015, the following samples: 1850 1%, 1860 1%, 1870 1%, 1880 1% 1900 1%, 1910 1%, 1920 1%, 1930 1%, 1940 1%, 1950 1%, 1960 5%, 1970 1% State FM1, 1980 5% State, 1990 5% State, 2000 1%, 2010 ACS, 2016-2020 ACS (shown here as 2018).
Maps, data development, calculations: James Gregory.